9 March 2026
The Complete Guide to Amazon PPC Product Targeting
TweetLinkedInShareEmailPrint 18 min read By Rick Wong Updated Mar 10, 2026 TL;DR Why should new sellers...
Yes. You must shift your mindset from immediate Return on Ad Spend (ROAS) to Lifetime Value (LTV). A campaign that merely breaks even on the first purchase is highly valuable if it acquires a customer who generates recurring revenue for months.
Standard advertising reports won’t show this clearly. You must go to Reports > Fulfillment > Subscribe & Save Performance. Keep in mind this data is retrospective (historical), not real-time, so you must use it to spot trends rather than immediate ad results.
Don’t rely on the default Amazon toggle. Use coupons specifically for the first subscription order to lower the barrier to entry. Additionally, update your listing images and A+ Content to sell the “lifestyle” and convenience of the subscription habit, rather than just the product features.
Never rely solely on past sales history. Use the “Subscribe & Save Forecasting” report to view projected demand for the next eight weeks. You must “ring-fence” this inventory mentally—treating it as already sold—to ensure you never prioritize new customers over loyal subscribers.
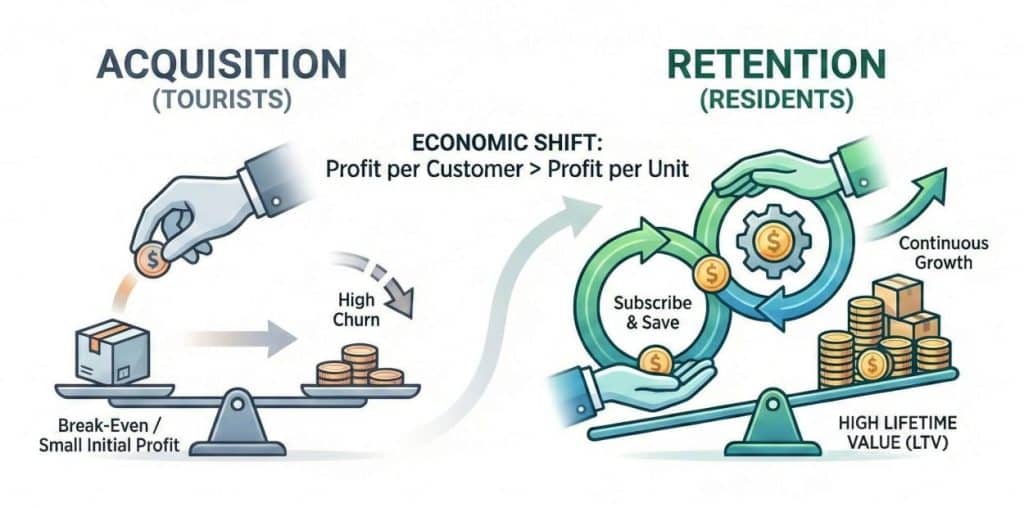
Most long-term value in e-commerce comes after the initial purchase. Any veteran seller knows that the Customer Acquisition Cost (CAC) for a one-time buyer often eats painfully into margins, leaving you with a sliver of profit that vanishes the moment you account for overhead.
The true wealth in the Amazon ecosystem lies in the “Subscribe & Save” (SnS) program. It is the mechanism that transforms a transactional marketplace into a source of reliable, compounding monthly recurring revenue.
However, there is a massive discrepancy in how Amazon sellers approach this program. Most treat it as a passive toggle. They enable it in their settings, offer a five percent discount, and hope for the best. They see a “Subscribe & Save” badge on their listing and assume the job is done. The limitation isn’t the feature itself, but how little attention is paid to the data behind it. This tends to be where many sellers quietly underestimate how much uncertainty sits between enabling SnS and actually understanding what it produces.
Tracking Subscribe & Save conversions is notoriously difficult. Amazon does not make it easy to see exactly which ad campaign drove a subscription or which specific keyword resulted in a loyal, repeat customer rather than a one-time purchaser. The data is often delayed, buried in obscure reports, or aggregated in ways that make granular analysis frustrating.
A clear understanding of this data tends to show up more often in larger, more stable operations. When you can accurately track and attribute your SnS conversions, you can afford more on acquisition costs because you understand the true Lifetime Value (LTV) of your customer.
This guide will deconstruct the complexities of Subscribe & Save conversion tracking. We will move beyond the basics and dive into the specific metrics you need to monitor, the reporting limitations you must navigate, and the actionable strategies you can employ to turn your data into a recurring revenue engine.
Before we dive into the technicalities of tracking, we must establish the economic framework that makes this tracking necessary. In the world of Amazon PPC and organic ranking, we are often obsessed with the immediate Return on Ad Spend (ROAS) or ACoS. If we spend ten dollars to get a twenty-dollar sale, we celebrate. But in the context of Subscribe & Save, a high ACoS on the first order might actually be a brilliant investment.
Consider a supplement brand selling a protein powder for thirty dollars. If the profit margin is ten dollars and the acquisition cost is ten dollars, the seller breaks even on the first sale. A novice seller might turn off that ad campaign, viewing it as a failure. A sophisticated seller who tracks SnS conversions knows better. If that specific campaign drives customers who subscribe at a rate of twenty percent, and the average subscriber stays for six months, the math changes entirely.
That initial break-even event just purchased a stream of future cash flow worth hundreds of dollars in revenue. That difference usually only becomes obvious weeks later, long after most campaign decisions have already been made.
Understanding this dynamic requires a shift in mindset from “profit per unit” to “profit per customer.” This is where your Amazon SEO Strategy must align with your long-term financial goals. You are not just optimizing for the click; you are optimizing for the relationship. When you track SnS conversions effectively, you can identify which keywords bring in “tourists” (one-time buyers) and which keywords bring in “residents” (subscribers).
You might find that broad, informational keywords result in lower immediate conversion rates but higher subscription rates. A customer searching for “how to build muscle over 40” might be looking for a long-term solution and is therefore more likely to subscribe than someone searching for a specific brand name they just want to try once. Without tracking this data, you would likely pause the informational keywords due to poor upfront performance, inadvertently cutting off your most valuable customer pipeline.
This economic reality dictates that the primary goal of your tracking efforts is to determine the “stickiness” of your traffic sources. You need to know if the traffic coming from Facebook Ads retains better than the traffic coming from Amazon Sponsored Products. You need to know if the customers who buy the three-pack are more loyal than those who buy the single unit.
Once you have this data, you can stop flying blind and start allocating your marketing budget to the channels and products that build the highest equity in your business. In practice, this calculation plays a larger role in how your brand grows over time.
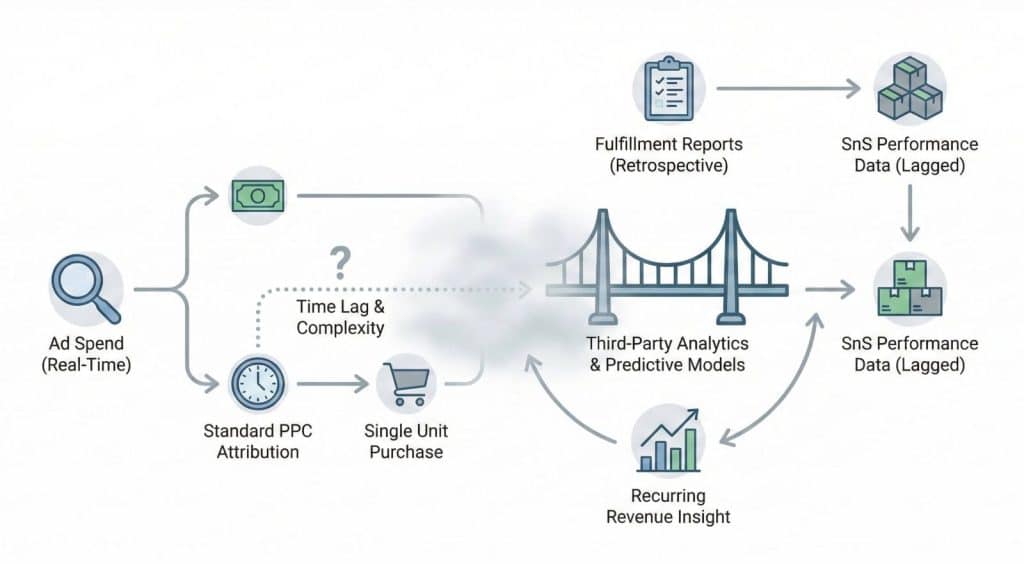
The primary challenge with SnS tracking is that Amazon’s default advertising reports do not explicitly tell you, “Campaign A generated 5 new subscriptions today.” The attribution window for Subscribe & Save is longer and more complex than standard attribution. A customer might click your ad today, buy a single unit to test it, and then come back three weeks later to subscribe. Standard PPC attribution might miss this second event entirely, or attribute it to organic traffic. None of these reports are wrong, but they rarely line up in a way that feels immediately usable.
To get a clear picture, you have to dig into the “Reports” section of Seller Central. Specifically, you need to become intimate with the “Fulfillment” reports. Under this tab, you will find the “Subscribe & Save Performance” report. This is your raw data source. It provides a breakdown of units shipped, the percentage of orders that are SnS, and the churn rate over time.
However, there is a catch. This report is retrospective. It tells you what happened in the past four weeks or the past year. It does not give you real-time feedback on yesterday’s ad spend. This delay forces sellers to operate with a certain degree of faith and estimation. You must analyze historical trends to predict future performance.
For instance, if you know that historically, ten percent of your sales on a specific ASIN convert to SnS, you can apply that multiplier to your current daily sales to estimate your future recurring revenue. This lack of real-time data is frustrating, but it is a constraint that affects every seller equally. The ones who win are the ones who build the most robust predictive models based on the lagged data they do have.
The disconnect between advertising data and fulfillment data is the biggest hurdle. Amazon’s ad console shows you sales. It does not differentiate between a one-time purchase and a “Subscribe & Save” initial order in the main dashboard columns easily.
To bridge this gap, you often have to rely on third-party Amazon Analytics Tools that can marry your PPC data with your order reports. These tools can help you visualize the correlation between ad spend spikes and subsequent subscription growth. By overlaying your ad spend data on top of your subscription start dates, you can often see clear patterns.
For example, if you ran a heavy promotion on Prime Day and see a spike in subscriptions 30 days later, you can reasonably infer a causal relationship. Without these advanced analytics, you are left guessing which marketing levers are actually moving the needle on your recurring revenue.
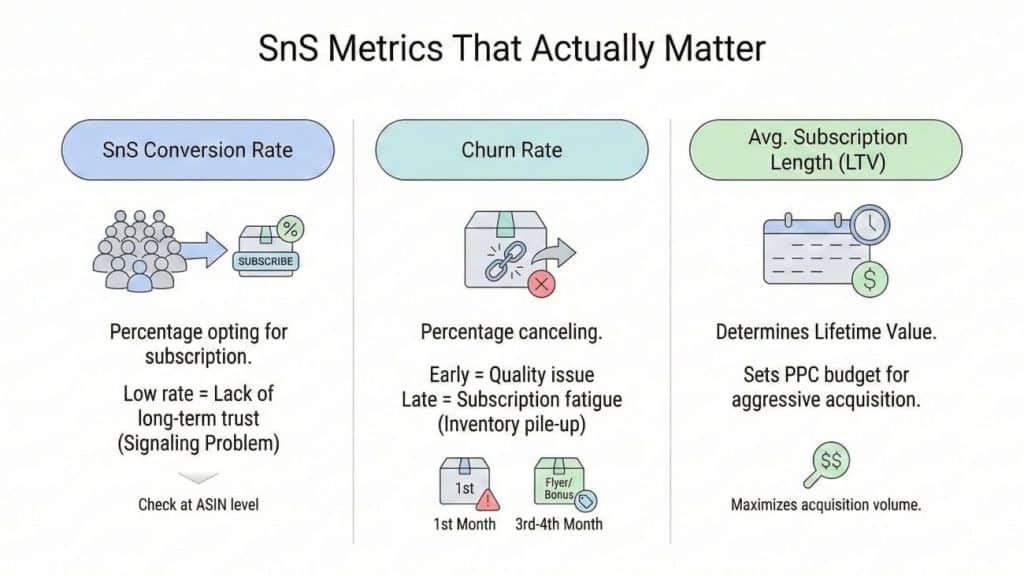
When you open your SnS performance reports, you will be greeted with a wall of numbers. To avoid analysis paralysis, you need to focus on three core metrics: The Conversion Rate, The Churn Rate, and The Average Subscription Length. Individually, each metric looks simple. Together, they explain why surface-level optimization often misleads.
The SnS Conversion Rate is the percentage of your total visitors or buyers who opt for the subscription model. If you have a high conversion rate on the product page but a low SnS conversion rate, it implies that customers want your product but do not trust it enough to buy it yet. This is a signaling problem. It means your listing content is convincing them to buy, but not convincing them to stay. You need to look at this metric at the ASIN level. A drop in SnS conversion rate on a specific product usually indicates a disconnect between the promise of the product and the perceived value of a long-term commitment.
The Churn Rate is the percentage of subscribers who cancel after a specific period. A high churn rate after the first shipment is a disaster. It usually indicates a product quality issue. The customer liked the idea of the product enough to subscribe, but once they held it in their hands or tasted it, they decided it wasn’t worth continuing. A high churn rate after the third or fourth shipment, however, is often a “subscription fatigue” issue. The customer might have too much inventory piling up. Monitoring churn allows you to intervene. If you know customers drop off after month three, you can insert a marketing flyer in the month two shipment, offering a surprise bonus or a usage guide to reinvigorate their interest.
The Average Subscription Length tells you the LTV. If the average customer stays for four months, you know exactly how much you can afford to pay to acquire them. This metric effectively sets your budget for Amazon PPC Services and marketing efforts. If you know a customer is worth fifty dollars in profit over their lifetime, you can confidently bid five dollars for a click, whereas a competitor who thinks the customer is only worth ten dollars (the profit on the first sale) will drop out of the auction. This metric is your competitive advantage. It allows you to be aggressive when others are being conservative. It changes the psychology of your bid management from “minimizing cost” to “maximizing acquisition volume” within a profitable LTV framework.
Once you are tracking these metrics, the next logical step is to improve them. You cannot just hope for more subscriptions; you have to engineer your product detail page to encourage them. Most buyers do not actively think in terms of subscriptions until the page gives them a reason to.
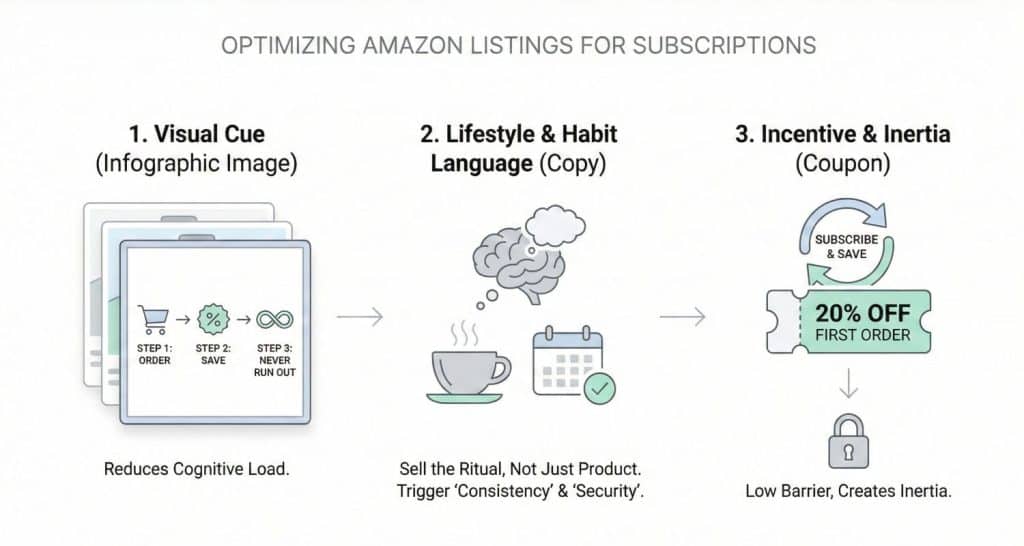
This goes beyond the default Amazon radio button. You need to use your images and your copy to sell the “lifestyle” of the subscription. Your image stack is prime real estate. One of your secondary images should explicitly explain the benefits of subscribing. Do not assume the customer knows how it works. Use an infographic that shows “Step 1: Order, Step 2: Save 15%, Step 3: Never run out.” This visual cue validates the decision to subscribe. It reduces the cognitive load on the buyer and makes the subscription feel like a savvy financial hack rather than a burden.
Furthermore, your bullet points and A+ Content need to speak to the habit. If you sell coffee, don’t just talk about the taste. Talk about the morning ritual. Talk about the horror of waking up to an empty cupboard. Position the subscription as a service that protects their morning peace, rather than just a financial transaction. This is where professional Amazon Listing Optimization Services can provide a significant ROI. By tailoring the language to trigger a “security” or “consistency” psychological trigger, you can nudge the customer toward the SnS option. You want the customer to feel that subscribing is the “smart” choice, the choice that responsible, organized coffee lovers make.
Another powerful lever is the “Subscribe & Save” coupon. Amazon allows you to offer a coupon that applies only to the first Subscribe & Save order. This is a potent incentive. A twenty percent off coupon for the first subscription order creates a low barrier to entry. The customer feels like they are getting a steal, and you get them into your ecosystem. Once they are in, inertia takes over. As long as your product quality holds up, they are unlikely to go through the hassle of cancelling. This strategy effectively front-loads the discount to acquire the customer, knowing that the subsequent full-price orders (minus the standard SnS discount) will pay back that initial investment many times over.

Relying solely on Amazon’s internal traffic is a limiting strategy. To truly supercharge your Subscribe & Save numbers, you should look outside the marketplace. External traffic allows you to qualify the customer before they ever reach Amazon. By using a landing page or a sales funnel, you can educate the customer on the benefits of the subscription model without the distractions of competitors’ ads on the Amazon sidebar.
When you drive traffic from Facebook, Instagram, or an email list, you are dealing with a warmer audience. You can use these channels to tell a longer story about your brand. When they finally click through to Amazon, they are already pre-sold. At that point, the marketplace is no longer doing the first explanation for you.
This creates a powerful Amazon flywheel effect. The external traffic boosts your sales velocity, which improves your organic ranking, which brings in more internal traffic, which leads to more subscriptions. It is a virtuous cycle.
Specifically, email marketing to your existing customer base is a goldmine for SnS. If you have a list of customers who have bought from you once, send them a campaign specifically highlighting the financial benefits of subscribing. Show them the math. “You spent $100 on coffee last year. If you had subscribed, you would have saved $15 and never had to run to the store.” Logical appeals work very well for consumables.
Additionally, using influencers to push the subscription angle can be highly effective. If an influencer explains that they use the “Subscribe & Save” feature to ensure they never run out of their favorite protein powder, their followers are likely to mimic that behavior. It adds social proof to the logistical mechanism of the subscription. It normalizes the behavior of subscribing.
You can track the effectiveness of these external campaigns by using Amazon Attribution tags. While Attribution doesn’t perfectly track every subscription event due to the window issues mentioned earlier, it gives you a much better directional sense of which external channels are driving high-intent traffic compared to the blind traffic of standard PPC.
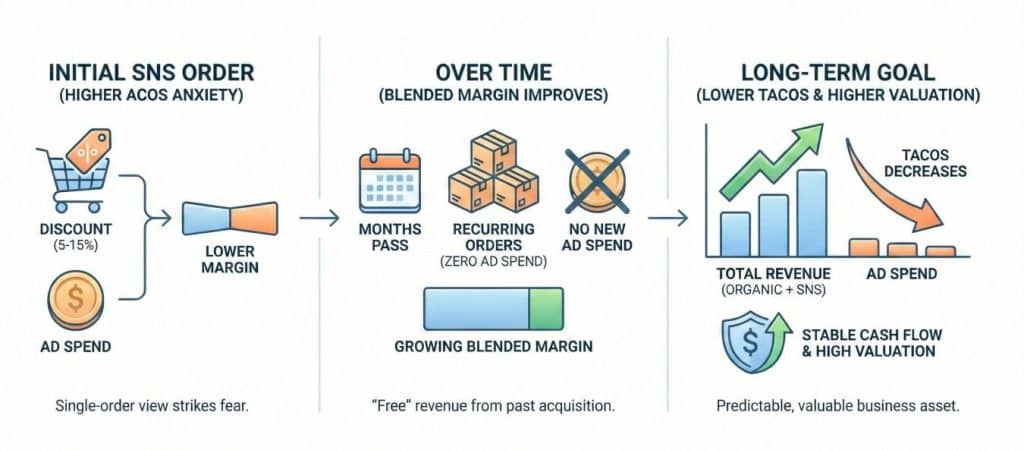
Tracking SnS conversions inevitably leads to a discussion about profitability. Because you are giving away a discount (usually 5% to 15%) to subscribers, your margin per unit is lower. This strikes fear into the hearts of many sellers who are obsessed with ACoS (Advertising Cost of Sales). They worry that the discount plus the ad spend will make them unprofitable.
This is where you must look at What is a good TACoS on Amazon. TACoS (Total Advertising Cost of Sales) measures your ad spend relative to your total revenue, including organic and recurring sales. As your Subscribe & Save base grows, your TACoS should ideally decrease over time. This is also why single-order margin analysis tends to break down once subscriptions reach meaningful volume.
Why does TACoS decrease? Because those recurring orders do not require new ad spend to generate. They are “free” revenue in the sense that you already paid for the customer months ago. A healthy SnS program will initially look like a drain on margins because you are acquiring customers. But fast forward six months, and that cohort of subscribers is generating revenue every month with zero ad spend. This depresses your TACoS and increases your overall business valuation. Buyers and aggregators love high SnS percentages because it represents stable, predictable cash flow. It reduces the risk profile of the business.
Therefore, when you are analyzing your SnS tracking data, do not panic if your direct profitability on the first order looks slim. You need to model out the profitability over a 12-month period. If you are tracking the data correctly, you will see that the “blended” margin of your business actually improves as the ratio of subscription revenue to one-time revenue increases. The goal is to reach a tipping point where your recurring revenue covers your fixed costs, giving you immense freedom to experiment with new product launches and aggressive marketing tactics without risking the stability of the company.
One of the most dangerous pitfalls of a successful Subscribe & Save program is running out of stock. If a customer subscribes to your toothpaste, they expect it to arrive every month. If you go out of stock, Amazon will skip the shipment, and the customer might be forced to buy a competitor’s product. Once they switch, you might lose them forever.
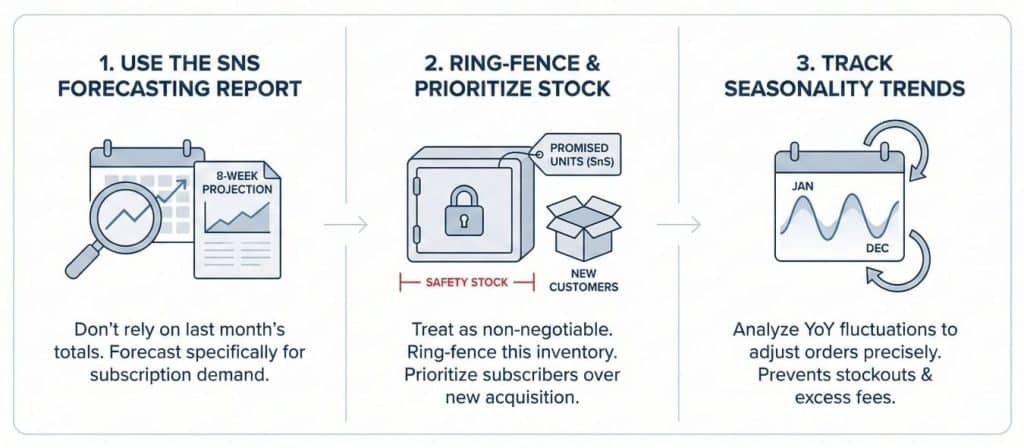
Therefore, tracking SnS conversions is also a supply chain necessity. You cannot forecast inventory based on last month’s total sales alone. You must look at your “Subscribe & Save Forecasting” report. This report projects your demand specifically for subscription orders for the next eight weeks.
This is less about optimism and more about honoring an expectation you already created. You must treat this demand as non-negotiable. These are promised units. Sophisticated sellers ring-fence this inventory mentally. They know that if they have 1,000 units coming in, and 400 are needed for SnS, they only really have 600 units available for new customers. Failing to account for this can lead to stockouts that not only kill your sales rank but also destroy the trust you built with your most loyal customers.
You should always carry a “safety stock” specifically for your subscribers. If you anticipate a supply chain delay, you should consider turning off ads to slow down new customer acquisition rather than risking the supply for your existing subscribers.
Furthermore, you need to track the seasonality of your subscriptions. Do people pause their subscriptions in December? Do they double up in January? Your tracking data holds the answers. By analyzing year-over-year trends in your fulfillment reports, you can anticipate these fluctuations and adjust your inventory orders accordingly. This level of precision prevents you from paying storage fees on excess stock during slow months and prevents stockouts during peak months. It turns inventory management from a guessing game into a data-driven science.
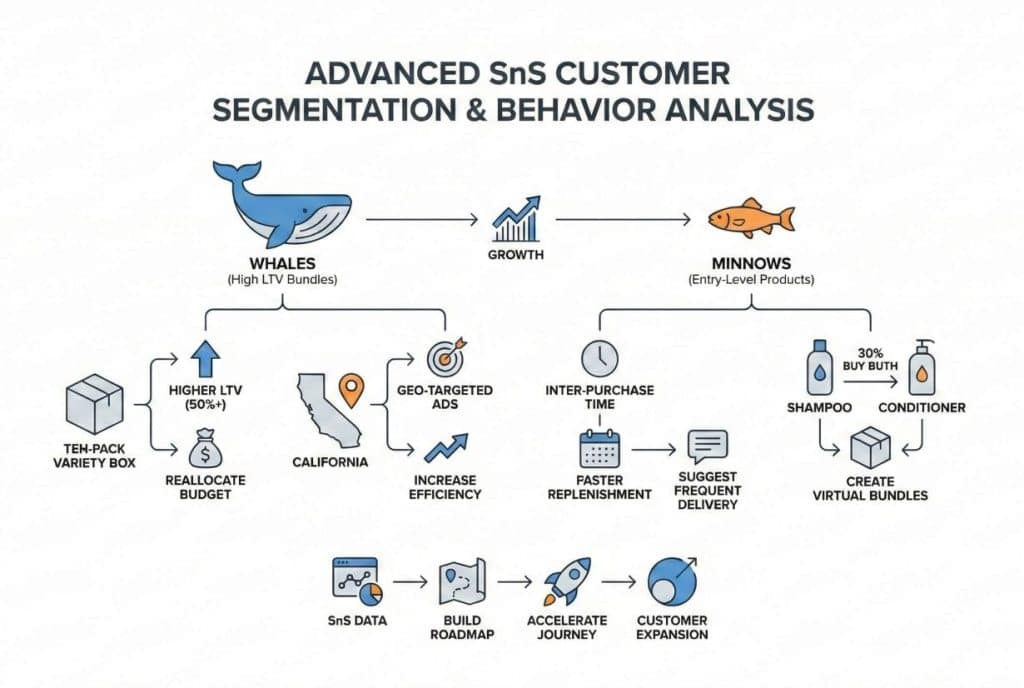
If you want to take your tracking to the genius level, you need to segment your SnS customers. Not every subscriber behaves the same way, even when they start from the same listing. You will have “Whales” who subscribe to your most expensive bundles, and “Minnows” who subscribe to your cheapest entry-level product. You can use the data in your fulfillment reports to identify which ASINs are the “gateway drugs” to your brand.
Perhaps you find that customers who enter through your ten-pack variety box have a 50% higher LTV than those who enter through a single-flavor pack. This insight allows you to redirect your budget. You stop advertising the single packs aggressively and pour your money into the variety box, knowing it builds a better customer base.
Additionally, pay attention to the geography of your subscribers. Are they clustered in specific regions? This might inform your external advertising targeting. If you see a high density of subscribers in California, you can run geo-targeted Facebook ads in that state with copy that appeals to that demographic, increasing the efficiency of your spend. You can also analyze the “inter-purchase time” of your subscribers. Are they replenishing every month, or every two months? If the average usage rate is faster than the default subscription cadence, you are losing revenue. You might need to update your listing to suggest a more frequent delivery schedule or offer a larger size.
You can also use this segmentation to identify cross-selling opportunities. If you see that 30% of the people who subscribe to your shampoo eventually subscribe to your conditioner, you can create a virtual bundle or use “Sponsored Display” ads to target your shampoo purchasers with the conditioner.
You are essentially using your SnS data to build a roadmap for customer expansion. You are not just guessing what they might like; you are looking at what the most loyal segment of your audience actually buys, and then accelerating that journey for everyone else.
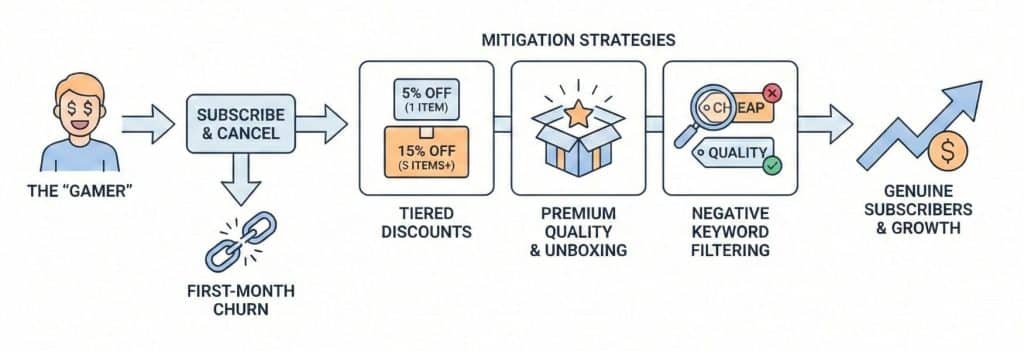
You must also be aware of customers who “game” the system. These are savvy shoppers who subscribe solely to get the immediate discount and then cancel before the second shipment. This is why looking at the churn rate after the first shipment is so vital. If you see a massive spike in immediate cancellations, your discount might be too aggressive, or you might be attracting the wrong type of bargain-hunter customer.
While you cannot completely eliminate this behavior, you can mitigate it. One way is to offer a modest discount for the subscription (e.g., 5%) but a larger tiered discount if they subscribe to multiple items (e.g., 15% for 5 items). This raises the bar for the “gamer” and encourages genuine bulk buyers.
Another strategy is to ensure your product delivers immense value immediately. If the unboxing experience is premium and the product works perfectly, the customer who intended to cancel might just forget to do so, or decide they actually want to keep it. The quality of the product is the ultimate retention tool.
You can also use your tracking data to identify if specific keywords are driving these low-quality subscribers. If you find that keywords like “cheap [product name]” or “discount [product name]” result in high first-month churn, you should negative match those keywords. You want to attract customers looking for quality and consistency, not just the lowest price.
Ultimately, a certain level of gaming is the cost of doing business. Do not let it discourage you from the program. The data usually shows that even with a percentage of gamers, the overall lift in revenue from the genuine subscribers far outweighs the cost of the “one-and-done” discount seekers. It is a numbers game, and as long as your LTV calculations include this churn factor, your profitability model will hold up. The key is to monitor it so it doesn’t spiral out of control, not to fear it so much that you cripple your growth strategy.
Tracking Subscribe & Save conversions is not just about filling out a spreadsheet. It is about understanding the heartbeat of your Amazon business. It requires you to look beyond the vanity metrics of daily sales and stare deep into the mechanics of customer loyalty.
The sellers who win in the coming years will be the ones who treat their Subscribe & Save data with reverence. They will use it to inform their product development, their inventory planning, and their advertising strategy. They will accept lower margins today for higher gains tomorrow. They will understand that a business built on one-time transactions is a hamster wheel, while a business built on subscriptions is a flywheel.
By leveraging the reports in Seller Central, utilizing advanced third-party tools, and optimizing your listings for the long haul, you can turn the chaotic Amazon marketplace into a predictable revenue stream. It requires patience, diligence, and a willingness to dig into the messy data, but the reward is a brand that is resilient, profitable, and immensely valuable.
The path to an eight-figure exit is paved with recurring revenue, and the map to that revenue is hidden in your Subscribe & Save reports. Start reading them today.
Data typically lags by two to four weeks in performance reports; for accurate inventory planning, rely on the 8-week Forecasting report.
Yes, frequent stockouts can cause Amazon to suppress your SnS eligibility and will force customers to switch to competitors.
SnS is primarily for FBA sellers; FBM participation is restricted to Seller Fulfilled Prime or invited accounts with strict metrics.
Consumables often see 10-30% conversion rates, while durable goods will see near-zero rates due to the nature of the product.
The Buy Box shows the one-time price, but the SnS price may appear more prominently to repeat buyers, impacting your margin.
No, Amazon anonymizes all customer data; you can only see aggregate cancellation counts and general reason codes.
There is no joining fee, but you must fund the 5% to 15% discount given to customers directly from your own margins.
Fluctuations occur due to skipped shipments, holiday seasonality, and Amazon’s periodic data cleansing of invalid accounts.
No, customers must opt-in voluntarily; using deceptive “dark patterns” to trick users violates policy and risks suspension.
Yes, if you create a new ASIN, you risk losing subscribers; you must manage variations carefully to migrate them.

9 March 2026
TweetLinkedInShareEmailPrint 18 min read By Rick Wong Updated Mar 10, 2026 TL;DR Why should new sellers...
27 February 2026
TweetLinkedInShareEmailPrint 8 min read By Rick Wong Updated Feb 27, 2026 TL;DR What is the optimal len...
18 February 2026
TweetLinkedInShareEmailPrint 8 min read By Rick Wong Updated Feb 18, 2026 TL;DR Is AMC free and availab...