24 July 2026
hello world
TweetLinkedInShareEmailPrint hello world TweetLinkedInShareEmailPrint

Every Amazon Seller knows how important it is to run effective Amazon PPC campaigns and to learn how about Amazon PPC Management. In a heavily saturated market, the only thing setting you apart from competitors is the quality of your listing and how visible it is to customers. It takes a lot to optimize Amazon PPC campaigns, which is why being able to dive into Amazon PPC Reports to extract actionable insights is key to success for Amazon sellers.
The key to Amazon PPC is monitoring your performance metrics and constantly optimizing your campaigns. Find out which Amazon Advertising reports are the most useful to you, and how to interpret them.
Article Contents
Amazon offers a variety of Amazon PPC reports for each campaign type. There are 4 campaign types, Sponsored Products (SP), Sponsored Brands (SB), Sponsored Brand Videos (SBV) and Sponsored Display (SD). Each of these campaign types have different reports available for your selected time period.

Sponsored Products reporting is focused on measuring performance at product listing level. These reports help you understand how effectively you are driving traffic to specific ASINs. As Sponsored Products Ads often appear in Amazon search results and sometimes on product detail pages it’s important to look at these reports and also to consider their implications on listing optimization (More information on our Amazon Listing Optimization Services).
Reports for Sponsored Products typically include performance metrics (clicks, impressions, cost per click) and can help you:
For sponsored products, the following reports are generated by Amazon:
Sponsored Brands Ads sit a bit more mid-funnel. These ads offer more creative variability and highlight your brand logo, a custom headline, and feature multiple products. Reports for Sponsored Brands often provide information on campaign performance at the keyword level or the creative level. If you’re aiming to build brand awareness or cross-sell multiple products, these insights help you:
For sponsored brands, the following reports are generated by Amazon:
For sponsored brand videos, only four reports are generated by Amazon and these are:
An SBV campaign is still within Sponsored Brands, so each report provides the same information as is stated in the “Sponsored Brands” section above. Pay particular attention to evaluating performance by placement.

Sponsored Display allows you to retarget past visitors on and off Amazon, as well as target relevant audiences with display ads. While especially display remarketing ads can help you “close” a sale, generally speaking the cost efficiency of display ads is lower than that of other search dominated ad formats. Reports for Sponsored Display typically include unique data points on how audiences interact with your ads, such as:
For sponsored display, only four reports are generated by Amazon and these are:

Downloading your Amazon Advertising reports is fairly easy. First you go to Seller Central, then to the Advertising tab where you will find Campaign Manager.

Once you are in the campaign manager, click the sidebar and select “Reports.”

Once you do, it’s very straightforward. You can see a list of reports you have previously generated. To generate a new one, click “Create report” and it will open a new window.
In this new window, you can select the Campaign Type, the type of report you want, the time unit and select a time period. Underneath this, you can name the file, and choose to receive an email once the report is available for download. Click “Run report” in the top right corner.

Wait for a few minutes, then refresh the page. The download symbol will have appeared on the right, click it to download the file. Reports are all generated in .csv format, you can convert them to Excel manually if you prefer.
The keyword data you need will predominantly be in your Sponsored Products (SP) and Sponsored Brands (SB) campaigns. The best Amazon PPC reports to download for optimization and bid management are:
These 4 reports will provide you with the bulk of your search term & keyword data for your selected time period. They list your campaign, ad group, target keywords, search terms, match type. In addition, they provide performance metrics for each of those keywords/search terms, including- 7 Day sales, AcoS, RoAS, Orders, Units, CTR, CVR, advertised SKU units and advertised sales.
If you want some additional data, you can also download the following 2 reports:
Search term impression share reports have mostly the same data
A more ambitious way to consolidate your keyword data would be to download a Bulk spreadsheet. These are the go-to method for Amazon PPC management. Go to the Campaign Manager, then click the panel on the left and select “Bulk Operations” to reach the screen below.

If you’re a beginner to Amazon PPC, this might be overwhelming for you. In that case we suggest you stick to the Search term and Keyword reports we mentioned earlier. You can use those to isolate low-performing keywords easily, and then store a list of them to manually update on Campaign Manager later. Or, you could find a bulk upload template, and insert the relevant data into it.
If you’re not a beginner, or if you’re simply looking for the most efficient process, then we recommend downloading Amazon PPC bulk data. Amazon will allow you to download up to 3 months of PPC data, which is what we recommend you to do. Remember to set the end date 3 days before the date available for selection – this is because bulk PPC data is not attributed in real time. Data from 3 days ago will be your most recent and accurate data.

So, if you really want to speed up the process of eliminating keywords, you can just start off by downloading ALL your PPC data for a given period in bulk! Then, you can isolate the low-performance keywords within it, and simply ‘pause’ those keywords in bulk. You can see the ‘status’ column outlined in red, this is where you simply type in ‘paused‘ for the keyword you no longer want active in your campaigns.
You can also write ‘archived‘ to totally delete that keyword. Note that you won’t be able to make it ‘active’ again. So we recommend just pausing it instead, in case you change your mind and want to put that keyword back in your campaign later.
Once you have downloaded the reports you need. Remember the primary goal of Amazon PPC management – to remove low-performing keywords. Another way to think of this is “cutting bleeders.” “Cutting bleeders” is a term coined by Sean Smith, who created an incredibly useful Amazon PPC course. We will be borrowing some of his methods, and also recommending other tactics we use in conjunction with those basics.
So what is “cutting bleeders”? Simply put, ‘bleeders’ are bad keywords (or even entire ad groups) that are bleeding you dry of ad spend. What you want to do is isolate them from your campaigns, and then cut them out.
This is the easy part of Amazon PPC management. Download the reports you need. Whether this is a Search term report or a Bulk spreadsheet, that is up to you. The following are the paths to download the reports you want:
PPC Reports: Amazon Seller Central -> Advertising -> Campaign Manager -> Top left dropdown -> Reports
Bulk Data: Amazon Seller Central -> Advertising -> Campaign Manager -> Top left dropdown -> Bulk Operations
Before you filter your data, make sure to delete any duplicate values. This is especially true in Search term reports, where some keywords may be duplicated.
We suggest adding an initial column that serves as “Index“. This can be a concatenation of the following columns:
| Campaign Name | Ad Group Name | Targeting | Match Type | Customer Search Term |

This will ensure each row is now unique, and you can use the Index column to remove any duplicates.
Now comes the actual analysis. At this point you need to make a few decisions:
We can offer some guidelines, but at the end the actual performance metrics you prioritize are up to you.
This is a very basic method borrowed from PPC AMS Accelerator Course by Sean Smith. This lets you isolate low-performing keywords. Why those filters? Because, you’re getting clicks, expending ad spend, and yet getting 0 orders. This means the keyword is not converting.

This is a screenshot of an edited Search Term report (some columns were deleted), bulk reports can be similarly filtered
You can experiment with those ranges, say, you may think Spend of $1 is too low because you keep a bigger budget for PPC. Or, you want Orders=>10, because you think anything less than that is not worth it. If so, you can change the ranges. It’s very easy to filter headers in Excel, as seen above.
An easier way to filter out extremely low-performance keywords is to simply use 1 filter: ACoS.
For example, a keyword with over 100% ACoS is not converting many sales. You are spending far more on it than you are gaining. We suggest to filter out any keywords with ACoS=>100%, and pause them if they are irrelevant.

This is the simplest method to find low performing keywords. While it’s a good base analysis, you may lose out on some good keywords this way too. Many of the best keywords have very high CPC, which makes the ad spend & ACoS high. Many sellers choose to keep high ACoS keywords, seeing it as a long-term investment.
In the end, it’s up to you which performance metrics you use to isolate low-performance keywords.
Analyzing Excel files and manually updating your PPC campaigns is incredibly time-consuming. Using bulk uploads is much faster, but there are errors at times that you need even more time to figure out and fix. So, why not cut down the process and simply automate it?
We at SellerMetrics provide a robust bid automation software that does the heavy lifting for you.

Set ACoS goals on a campaign level, bid thresholds and you can even add rules for specific search terms.

If you prefer manual bid optimization, our software also allows you to do that.

Automating your PPC bid optimization can save you so much more time that you can use to grow your business. Contact us to get a free demo of our PPC Software, or try it for free.
While there is a great abundance of reports, not all of them are useful. For example, the Performance Over Time report is a one-line report that doesn’t really offer any useful information, just a 1-line summary that tells you total clicks, CPC & spend for your all your ads.
So which reports are useful?
This is the most useful report Amazon Advertising has to offer. Search term reports are a gold mine because they tell you which of your targeted keywords are actually converting into clicks & sales. SB and SP search term reports are the key to PPC optimization, without them, it’d incredibly difficult to find out which keywords are performing well, and which aren’t. More in this in our blog post on Amazon Search Term Optimization.
You get performance metrics like Impressions, Clicks, CTR, CPC, CVR, Sales, Spend, ACoS and RoAS for your keywords-
Not only that, you can actually see the exact search queries customers are making! You can then find new keywords to bid on from these queries. You can also see which keywords are being allocated to which search term. Using CPC, you can calculate the average CPC for a set of search terms, or you can sort by Impressions to find out where you’ll get the highest visibility. Search term reports are a treasure trove of information that every seller should be analyzing!
SB keyword reports are the next best Amazon Advertising report you should be generating multiple times a week. For SP campaigns, the equivalent is the Targeting report. These reports tell you how every keyword or ASIN you are targeting is performing over your selected time period.
Similar to the Search term report, you can see valuable performance metrics for every target in each campaign & ad group. These include- Impressions, Clicks, CTR, CPC, Sales, Spend, CVR, ACoS, and RoAS. You can filter the header rows easily in Excel. For example, filtering above a target CTR to remove underperforming keywords or ASINs in your campaign. Even better, sorting it by highest to lowest ACoS then adjusting bids for high ACoS targets.
Search term impression share reports for SB and SP are similar to search term reports, but they contains 2 extra pieces of information. These 2 metrics are something a lot of sellers find useful – 1) search term impression rank 2) search term impression share.
This metric compares your SB or SP ads to your competitors’ ads, and assigns you a rank. So if a search term/keyword has a ST Impression Rank of 1- you’re beating all your competitors in impressions! This metric is perfect for isolating any keywords you are not gaining impressions for.
This metric also compares your SB or SP ads to your competitors’ ads, but in a different way. ST impression share shows you the share of ad placements you won from all the SP or SB product impressions in that period. For example, a search term impression rank of 60% on June 1st for the keyword “foosball table”, means you won 60% of total SP impressions that the keyword got on that day.
Out of all the Amazon Advertising reports, Search Term Impression share report is one that lets you benchmark your keywords against competitors. It’s one report every seller should generate at least once a week.
Ad placement is a key focus for Amazon PPC. The most visible and desirable placement for a Sponsored Product ad is Top of Search. These are the first products the customer see, and most of the time, these are the ones they end up buying.
Downloading a .csv of placement data from Amazon is extremely useful. You can get a broad overview of how many impressions each type of ad placement is getting. Usually Top of search perform the best, but it is good to monitor this, just to see if maybe ads in the Rest of Search are actually performing better. Whenever these placements perform better, you can increase your bid adjustment % to get even better results.
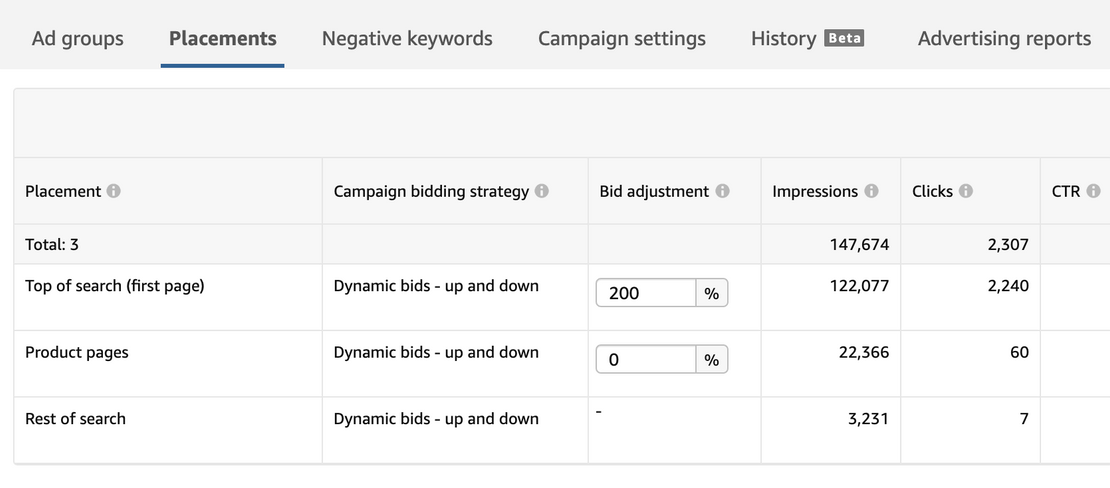
This is especially useful to keep an eye on how your Top of Search ads are performing, and which campaigns need an adjustment.
The bulk of the useful reports lie in SB and SP, but there are still 2 reports that are vital for SD campaign optimization. These are the Advertised Product report and the Purchased Product report.
As a brief overview, the Advertised product report provides insights for all your Sponsored Display advertised products (as long as they had at least 1 impression). The purchased product report provides data on NON-ADVERTISED products that were purchased by customers who clicked on your SD ad.
These two reports are best used in conjunction with each other.
Using the Advertised Product report you can see how well your SD ads are doing overall, and adjust bids if necessary. Using the Purchased Product report you can see which ASIN led to a product purchase, this might not be your own product. Often customers who end up purchasing your product actually clicked on another ASIN first. This provides you with a perfect list of competitor product pages to target with more SD ads. Both these reports together provide a holistic overview of how well your SD ads are doing.
One of the biggest challenges for many sellers is translating raw numbers into actionable insights. Here’s a deep dive into the core metrics you’ll see in your Amazon PPC reports, plus tips on how to interpret them.
CTR is the ratio of clicks to impressions. A high CTR suggests your ad copy, images, and relevance to the search query are on point. If your CTR is low, consider:
Conversion rate indicates what percentage of clicks led to an actual sale. A lower CVR may signal:
CPC tells you how much you pay for each click. This varies based on the competitiveness of your target keywords and category. If your CPC is too high relative to your margins, evaluate whether those keywords are truly profitable or if you should lower your bids.
Arguably the most referenced metric, ACOS is your total ad spend divided by total ad revenue. The ideal ACOS depends on your profit margins, so there’s no universal “good” number. However, a lower ACOS generally indicates better efficiency.
ROAS is the inverse of ACOS (total ad revenue divided by total ad spend). A higher ROAS is positive, but it shouldn’t be your only focus—sometimes investing in brand awareness with a lower ROAS can still lead to long-term gains in organic ranking.
TACOS measures your total ad spend as a proportion of overall revenue (organic + ad-driven). This is useful for understanding whether your ad spend is helping to lift total sales, including organic. A decreasing TACOS over time often indicates that your ads are boosting organic visibility and reliance on ads alone is diminishing.
Why This Matters:
Simply skimming metrics doesn’t provide value unless you link them to clear next steps. By understanding which metrics most directly affect your profitability and brand growth, you can optimize campaigns more effectively, whether that’s by adjusting bids, refining targeting, or improving product listings to convert clicks into sales.
Amazon PPC reports deliver crucial insights, but they come with certain pitfalls and limitations you should keep in mind.
Some metrics, especially conversions or attributed sales, can take up to 48 hours (or even longer) to fully populate. Avoid making impulsive bid changes based on less than 48 hours of data, as you may end up overcorrecting a trend that isn’t fully settled.
If your listings are suppressed or if there’s a technical issue with Amazon’s reporting interface, your PPC data might be incomplete. Check your account health and notification center regularly to ensure all campaigns are running smoothly.
When you launch a new campaign, it may take days or even weeks for Amazon’s algorithm to calibrate impressions and for you to gather enough data for actionable insights. Don’t assume immediate success or failure without giving the campaign sufficient time.
Focusing purely on ACOS (or ROAS) can be misleading if you’re also trying to boost brand visibility, launch a new product, or move overstock inventory. Sometimes a higher ACOS is acceptable if it drives longer-term gains (e.g., ranking for a high-traffic keyword).
Constant optimization is how every seller can achieve the perfect PPC metrics, and a successful Amazon store. That’s why it’s important to know which Amazon Advertising reports will provide the data you need to optimize well. In this article we provided an overview of Amazon PPC reports available for each campaign type, and then went on to tell you 5 of the best ones.
We hope that you found this a useful read, and will leverage this knowledge to analyse the best reports Amazon Advertising has to offer.
If you have questions or insights to share, please feel free to post them via the comments section. Please also consider joining our Facebook Group where we discuss any questions you may have about running an Amazon business.
We are SellerMetrics, our Amazon PPC tool helps Amazon sellers, brands, KDP Authors and agencies navigate Amazon Advertising PPC via bid automation, manual bid changes, and analytics.
24 July 2026
TweetLinkedInShareEmailPrint hello world TweetLinkedInShareEmailPrint

13 June 2026
TweetLinkedInShareEmailPrint 8 min read By Rick Wong Updated Jun 13, 2026 TL;DR What is Amazon Multi-To...

13 June 2026
TweetLinkedInShareEmailPrint 8 min read By Rick Wong Updated Jun 13, 2026 TL;DR What changed in the 202...