What is Amazon’s Search Query Performance (SQP) Report?
Suppose you’re an Amazon seller looking to maximize sales, dominate your category, and make smarter advertising decisions. In that case, the Amazon Search Query Performance (SQP) Report should be one of your go-to tools.
The SQP Report, located in Amazon Brand Analytics, offers detailed insights into how shoppers interact with your brand and products for specific search queries. It reveals what people search for, how often they click on your listings, and how often they buy across both organic and paid placements. Think of it as your Amazon store’s health check-up, only with way more detail.
Why is this a game-changer?
It shows where you’re winning and where you’re leaking sales.
It lets you see competitor share for specific keywords.
It provides actionable data to improve PPC targeting, organic rankings, listing quality, and pricing strategy.
While Amazon provides other data sources (like the Search Term Report), the SQP Report goes deeper, offering share-based metrics that let you benchmark your performance against the entire market, not just your campaigns. If Amazon is a game, the SQP report is your playbook.
In this guide, we’ll break down how to analyze the Amazon Search Query Performance Report step-by-step, what metrics to watch, and how to act on them to boost your profitability.
What Metrics and KPIs are Tracked in the SQP?
The SQP Report is a treasure chest of performance indicators. Here’s what you’ll find and why each matters:
Search Query Impressions
How often shoppers searched for a specific keyword in a given period.
Helps you gauge keyword popularity and seasonal trends.
Click-Through Rate (CTR)
The percentage of shoppers who clicked your listing after seeing it.
Low CTR often points to poor main images, irrelevant targeting, or weak titles.
Conversion Rate (CVR)
The percentage of clicks that resulted in a purchase.
Low CVR signals listing quality, review, or pricing issues.
Add-to-Cart (ATC) Share
Your brand’s percentage of add-to-cart actions for a query compared to all competitors.
A leading indicator of purchase intent.
Purchase Share
Your share of total purchases for a query compared to the competition.
Brand Share vs. Category Share
Brand share tells you your portion of a keyword’s sales within your own brand.
Category share shows how you stack up against all sellers in that niche.
Top ASIN Share
Reveals which of your ASINs dominate for a given search query and which ones lag.
These metrics aren’t just numbers on a spreadsheet—they’re diagnostic tools. They tell you why you’re not converting and exactly where you’re losing shoppers in the funnel, showing clues to where money is slipping through your fingers.
Where to Find the Search Query Performance (SQP) Report
Select Search Query Performance from the left-hand menu.
Choose Brand View (all your ASINs) or ASIN View (drill down to a single product).
Select your timeframe — weekly, monthly, or quarterly.
Export to CSV or Excel for deeper analysis.
Pro tip:
Use weekly data for quick pivots on ad campaigns.
Use monthly or quarterly data for strategic planning and trend analysis.
Common Findings & How Sellers Can Act On Them
The Amazon Search Query Performance (SQP) Report is more than just a set of numbers. It’s a window into your customers’ journey, from search to purchase. But the real value lies in knowing what those numbers mean and how to act on them.
Below are some of the most common patterns sellers see in the SQP report, what they usually indicate, and the practical steps you can take to turn those insights into profit with real-world examples from other Amazon sellers.
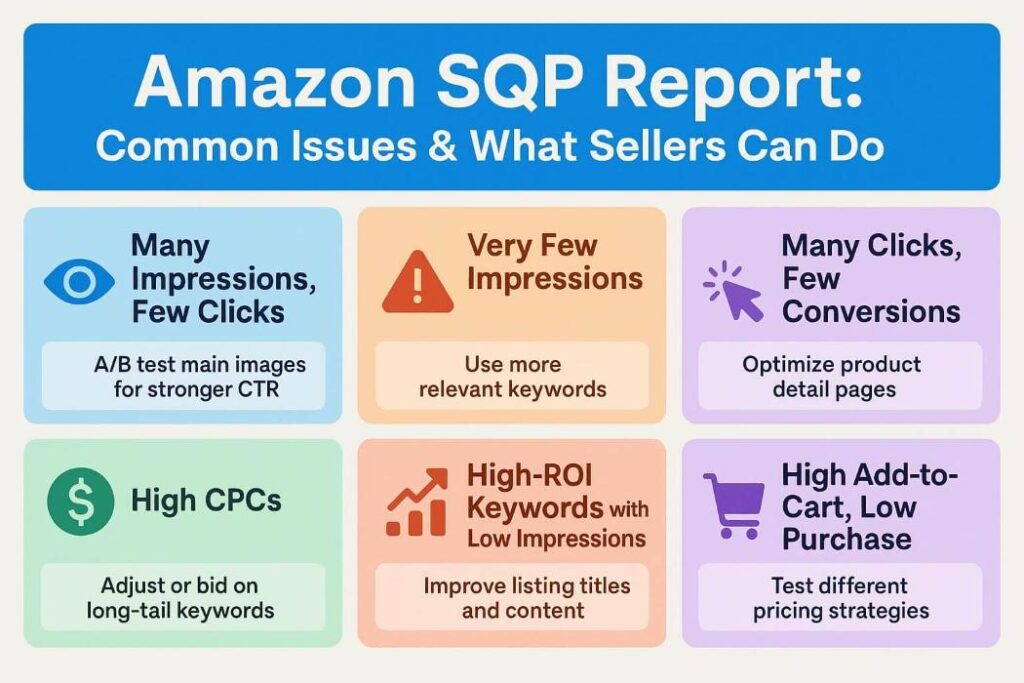
Many Impressions, but Few Clicks
What it means: Your listing is appearing in search results, but shoppers aren’t clicking through. This is a clear sign that while you’re getting visibility, your offer isn’t enticing enough to earn the click. First impressions matter. If shoppers see you but don’t click, it’s like waving at someone who walks right past.
Possible causes:
A main image that doesn’t stand out or communicate value.
Irrelevant keyword targeting — showing up for searches that don’t match your product.
An unappealing or unclear title that fails to hook buyers.
Action steps:
A/B test the main images to see which version drives higher click-through rates. Use lifestyle imagery or clear infographics to show benefits instantly.
Refine keyword targeting to ensure you’re bidding on terms that match buyer intent.
Rework your title to lead with the most compelling benefit or differentiator, while keeping it keyword-rich and readable.
Example: A kitchenware brand selling chef’s knives had high impressions for “ceramic knife” but very few clicks. After swapping their main image to one showing the knife slicing through a tomato in a lifestyle setting and adjusting targeting to focus on “stainless steel chef knife”, CTR jumped from 0.9% to 2.4% in just two weeks.
Search Terms with Very Few Impressions
What it means: You’re not getting enough visibility for certain keywords, often because you’re either not ranking organically or your bids aren’t high enough to compete. It’s like throwing a party and forgetting to send most of the invites.
Likely reasons:
Low organic ranking due to insufficient listing optimization or weak historical sales for the term.
Low bid competitiveness is causing your ads to lose auction share.
Action steps:
Increase bids strategically for high-value terms with low impressions.
Run targeted ad campaigns (Sponsored Products or Sponsored Brands) to build traction for these keywords.
Optimize your SEO — integrate the keywords into your title, bullet points, and back-end search terms to boost organic ranking over time.
Example: A sports supplement seller identified “plant-based protein powder” as a high-potential keyword with almost no impressions. By creating a Sponsored Brands campaign targeting that exact phrase and adding it to their bullet points, impressions increased by 480% in 30 days, with steady organic growth following.
Search Terms with Many Clicks but Few Conversions
What it means: Shoppers are interested enough to click, but they’re not buying. This indicates a breakdown between the promise of your ad/listing and the actual offer. That’s like getting people into your store, but they leave empty-handed. If curiosity isn’t turning into cash, something’s off.
Causes:
Listing mismatch — your product doesn’t fully match the shopper’s expectation from the search query.
Poor reviews or low ratings that create purchase hesitation.
Pricing issues — your product is more expensive than comparable options without a clear justification.
Action steps:
Audit your listing content to ensure the product matches the search intent and clearly communicates its benefits.
Address review concerns — improve product quality, follow up for positive reviews, and respond to negative ones.
Test pricing strategies such as limited-time discounts, coupons, or bundling to boost perceived value.
Example: A home décor seller was running ads on “rustic wooden shelves.” Their listing showed clean, modern shelves, which led to many clicks but low conversions. After updating their imagery and copy to highlight “modern farmhouse” styling (aligning with the rustic intent) and adding a coupon, conversions improved from 4% to 9%.
Search Terms with High CPCs
What it means: You’re paying a premium for clicks, which can quickly erode profitability if conversion rates aren’t high enough. High CPCs often occur in competitive niches or when bidding strategies are inefficient. If you’re paying too much for attention, it’s time to rethink the guest list.
Why it matters: If you’re overspending on clicks without proportional sales, you’re burning budget that could be reallocated to more profitable terms. Sometimes the most expensive clicks aren’t the most valuable.
Action steps:
Optimize bid strategy — lower bids on underperforming terms and reallocate spend to higher-ROI keywords.
Focus on long-tail keywords with lower CPCs and higher conversion potential.
Improve relevance (ad copy, listing content, and targeting) to raise Quality Score and potentially lower CPC.
Example: A beauty brand was paying $3.20 per click for “anti-aging serum” with a slim 2% conversion rate. By shifting budget to “vitamin C anti-aging serum” ($1.10 CPC) and improving the listing’s benefits section, they reduced ACoS from 72% to 35%.
Search Terms that Drive Revenue but Have Few Impressions and Clicks
What it means: These are hidden gems — keywords that convert well and bring in revenue, but aren’t getting much exposure. These are the gold nuggets hiding in your data.
Why they’re high-priority: With the right investment, these keywords can deliver exceptional ROI since they’ve already proven they attract the right kind of buyer.
Action steps:
Increase bids to win more auctions for these terms.
Boost organic SEO for these keywords to capture free traffic alongside paid clicks.
Use them in Sponsored Brands or Sponsored Display campaigns to expand reach beyond search results.
Example: A pet supply seller discovered “grain-free puppy chews” had a 15% conversion rate but very low impressions. After increasing bids by 40% and optimizing their title for that keyword, sales from this term grew 6x in six weeks.
High “Add-to-Cart” Share but Low “Purchase” Share
What it means: Shoppers are interested. They’re adding your product to their cart, but something is preventing them from completing the purchase. It’s like customers lining up at the register, then walking out. Something in the final lap is tripping buyers up.
Causes:
Pricing surprises (e.g., added fees or high shipping costs at checkout).
Shipping delays make competitors more appealing.
Poor checkout experience or lack of urgency to complete the order.
Action steps:
Adjust pricing or offer coupons to make your offer more competitive.
Offer faster shipping options where possible.
Create urgency with limited-time promotions or deals visible on the product page.
Example: A toy brand had a 14% add-to-cart rate but only a 4% purchase rate. After enabling free shipping for orders over $25 and running a “10% off today only” coupon, their purchase share rose to 9% within two weeks.
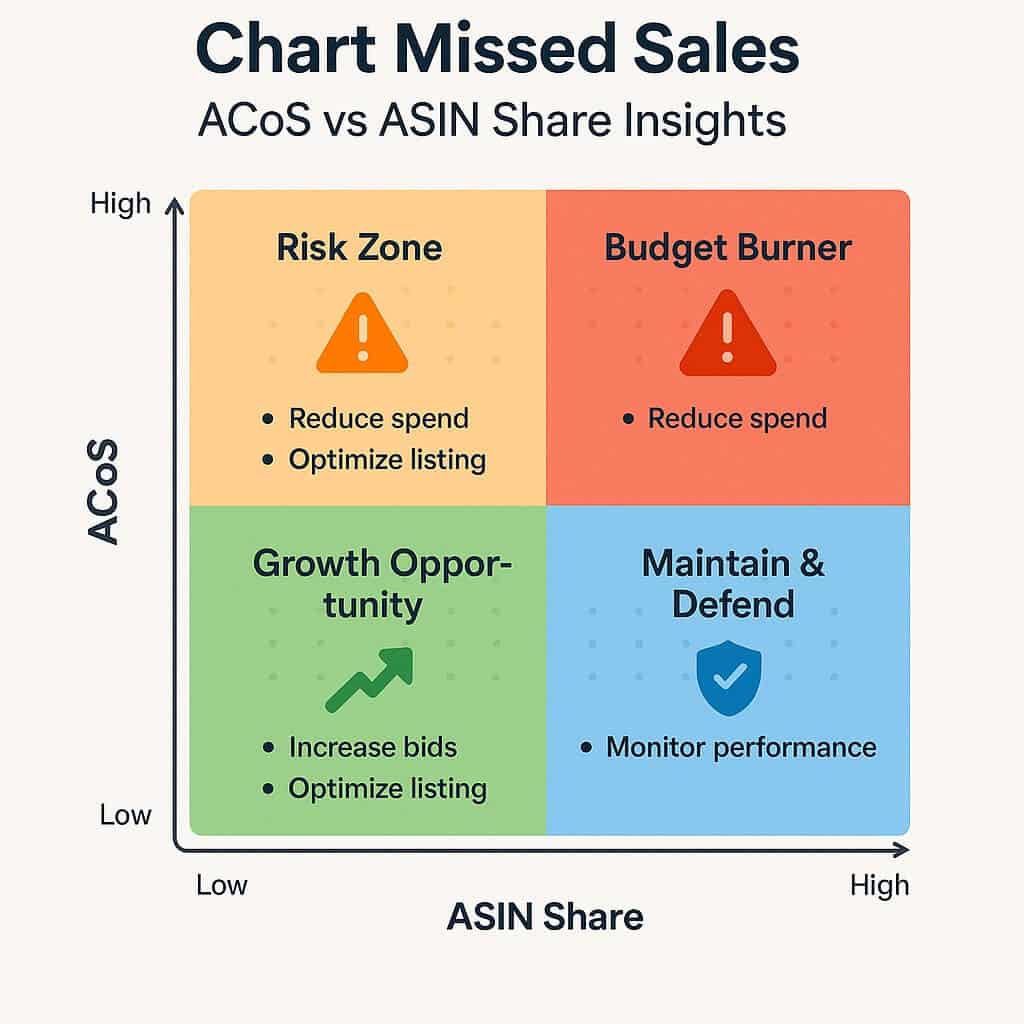
Charting Missed Sales Opportunities: Cost/Sales (ACoS) vs ASIN Share
One of the fastest ways to uncover missed revenue opportunities in your Amazon Search Query Performance (SQP) Report is to cross-reference your advertising efficiency (ACoS) with your share of conversions for each ASIN (ASIN Share).
When you plot these two metrics against each other, you’ll quickly see which keywords and products deserve more investment, and which are quietly draining your budget.
Step 1: Setting It Up in Excel or Google Sheets
1. Export the SQP Report from Brand Analytics
Select the time frame (monthly or quarterly is best for this analysis).
Select the time frame (monthly or quarterly is best for this analysis).
Export as CSV.
2. Import into Excel or Google Sheets and add the following columns:
Search Query
ASIN Share (from SQP report)
ACoS (from your ad performance report — match to the same time period)
Brand vs Generic Flag (you’ll add this manually — see below)
3. Tag each query as “Brand” or “Generic”:
Brand = contains your brand name (e.g., “Nike running shoes”)
Generic = does not contain your brand name (e.g., “running shoes men’s”)
Pro Tip: This step is critical — you’ll analyze these separately. High ASIN share for brand terms is expected, but scaling generic terms is what expands market share.
4. Create a “Profitability Category” column:
Low ACoS (profitable) = ACoS below your break-even threshold.
High ACoS (unprofitable) = ACoS above your break-even threshold.
5. Build a scatter chart:
X-axis = ASIN Share
Y-axis = ACoS
This visual instantly shows where you have scalable winners vs budget burners. It’s a quick way to turn guesswork into a growth plan.
Step 2: Interpreting the Data
Here’s how to read the scatter chart and spot opportunities:
Quadrant 2: High ASIN Share + High ACoS (Unprofitable)
What it means: You’re dominating for these terms, but it’s costing you too much
Possible reasons:
Overbidding in a competitive category.
Poor listing conversion rates (low CTR, low CVR).
Irrelevant traffic from overly broad keywords.
Action steps:
Lower bids or switch to placement modifiers to control spend.
Improve product images, titles, and bullet points to raise conversion rates.
Consider pausing or refining match types to eliminate wasted clicks.
Quadrant 3: Low ASIN Share + High ACoS (Risk Zone)
What it means: You’re spending a lot but getting little market share.
Possible reasons:
Competing on high-CPC generic terms without strong differentiation.
Ads not resonating (irrelevant copy or imagery).
Price is uncompetitive.
Action steps:
Reduce bids or pause non-performing keywords.
Shift focus to more specific, lower-CPC long-tail keywords.
Reassess your offer compared to competitors — pricing, reviews, and product value.
Quadrant 4: High ASIN Share + Low ACoS (Ideal)
What it means: You’re winning the market for these terms profitably.
Action steps:
Maintain current bid strategy.
Defend your position with brand ads and retargeting.
Test upsells or bundles to increase average order value.
Step 3: Why Brand vs Generic Segmentation Matters
If you don’t segment brand vs generic queries, you risk making false assumptions.
Example:
A low ASIN share on a generic term like “wireless earbuds” is a true growth opportunity if your ACoS is healthy.
But a low ASIN share on a branded term like “Sony wireless earbuds” may not be worth chasing if it’s irrelevant to your brand.
Key rules:
Brand terms are for defense — they protect repeat buyers and brand-loyal customers.
Generic terms are for growth — they expand your market share and bring in new customers.
Step 4: Scenarios to Watch For
Generic Queries + Low ACoS + Low ASIN Share
Action: Scale aggressively — these are your most profitable untapped opportunities.
Generic Queries + High ACoS + Low ASIN Share
Action: Consider pausing, refining targeting, or adjusting creative before spending more.
Brand Queries + Low ACoS + High ASIN Share
Action: Maintain — these are your bread-and-butter, but don’t overspend.
Brand Queries + High ACoS + High ASIN Share
Action: Reduce spend unless competitors are actively targeting your brand.
Step 5: Turning Insights into Action
Once you’ve mapped ACoS vs ASIN Share:
Focus budget on profitable, low-share generic terms to grow market share.
Fix inefficiencies on high-share but high-ACoS terms to improve profitability.
Use the scatter chart as a monthly checkpoint to keep your campaigns lean and effective.
Opportunities to Improve Listing Quality / Pricing: Add-to-Cart Share vs Purchase Share
One of the most revealing metrics in the Amazon Search Query Performance (SQP) Report is the relationship between Add-to-Cart (ATC) Share and Purchase Share.
When ATC share is significantly higher than Purchase share, it’s a red flag. It means shoppers are interested enough to commit your product to their cart, but somewhere between that point and checkout, something is stopping them from buying.
If you can identify what’s causing that drop-off and fix it, you can recover lost revenue without increasing traffic or ad spend, essentially turning wasted intent into actual sales.
Step 1: Mapping ATC Share vs Purchase Share in Excel or Google Sheets
To identify and analyze this gap efficiently, it helps to work outside Seller Central. Here’s how you can set this up:
1. Export your SQP Report:
In Brand Analytics, choose either Brand View (all ASINs) or ASIN View (for specific products).
Select your desired time period (weekly or monthly).
Export as a CSV file.
2. Import into Excel or Google Sheets.
3. Create key columns:
Search Query (from the report)
Add-to-Cart Share (numeric value, % format)
Purchase Share (numeric value, % format)
Gap = ATC Share – Purchase Share
4. Apply conditional formatting:
Highlight rows where Gap > 5 percentage points in red. This visually flags the biggest drop-off areas.
5. Sort by “Gap” column (largest to smallest) to focus on the biggest opportunities first.
Step 2: Interpreting the Data
A higher ATC share compared to purchase share means you’ve done the hardest part—convincing the shopper to seriously consider your product. But something along the purchase journey is creating friction.
Step 3: Common Reasons for High ATC Share but Low Purchase Share
While “something stops them from buying” is technically correct, that’s too vague to be actionable. Based on working with hundreds of Amazon accounts, here are specific, testable reasons for this gap:
Pricing Shock at Checkout
The base price looks competitive, but taxes, fees, or shipping costs increase the total unexpectedly.
Price is higher than competitors’ for similar products with no clear added value.
Shipping Delays or Limited Availability
Estimated delivery time is too long compared to alternatives.
Product is temporarily out of stock or has limited quantity warnings.
Better Competitor Offers
Shoppers add your product but discover another listing with better reviews, lower price, or more features before checkout.
Unclear or Missing Product Information
Shoppers add to cart to review later, but unanswered questions (dimensions, compatibility, usage instructions) cause hesitation.
Low Star Ratings or Negative Reviews
They notice low ratings after adding to cart when reading reviews in more detail.
Lack of Urgency or Purchase Incentives
No visible coupon, discount, or deal to encourage immediate checkout.
Poor Cross-Sell or Bundle Options
Shoppers see that competitors offer bundles or multi-packs with better value.
Change of Mind
This can happen if they’re “shopping around” and saving multiple products to compare later.
Step 4: Action Steps to Close the Gap
Once you’ve identified your biggest ATC-to-purchase gaps in your spreadsheet, here’s how to address them:
Optimize Price Points
Test small price adjustments (even $1–$2 can improve conversions).
Match or undercut key competitors when possible.
Offer Coupons or Discounts at Checkout
Add visible coupons or run Lightning Deals to create urgency.
Ensure Shipping and Delivery Estimates are Competitive
If delivery time is long, consider using FBA or other fulfillment options.
Enhance Product Information
Add dimension diagrams, comparison charts, and clear usage instructions to the listing.
Improve Reviews and Ratings
Encourage satisfied buyers to leave feedback.
Address product issues that lead to negative reviews.
Test Bundle Offers
Offer value packs or bundles to increase perceived value and average order value.
Why This Analysis Matters
Think of this gap as free money on the table. You’ve already paid (via ads or organic effort) to get the shopper’s attention, convinced them enough to consider buying, and then… lost them.
By mapping and analyzing ATC share vs Purchase share in Excel or Google Sheets, you get a clear, prioritized list of where sales are slipping away, and a roadmap for fixing it. Closing that gap is often easier—and cheaper—than finding new traffic.
Recap – Turning SQP Insights into Profitable Actions
The Amazon SQP Report is more than a data dump—it’s a blueprint for sales growth. By learning how to analyze the Amazon Search Query Performance Report, you can:
Pinpoint exactly where in the funnel you’re losing customers.
Optimize your listings and pricing for higher conversions.
Make smarter PPC decisions based on competitive benchmarks.
Once you see the SQP this way, you’ll wonder how you ever managed without it.
Our team specializes in helping sellers triage SQP data and turn it into actionable strategies that boost both PPC and organic performance.
FAQ: How to Analyze the Amazon Search Query Performance Report
How often should I review my SQP report? Weekly for tactical adjustments, monthly for strategic insights.
What’s the difference between the SQP and Search Term reports? SQP shows market share and competitive benchmarks; the Search Term Report only shows your own performance.
Can SQP data improve both PPC and organic sales? Yes — by optimizing for high-converting terms, you improve both paid and organic results.
What’s a “good” CTR in the SQP report? It varies by category, but we aim to outperform your category average.
Is the SQP report available to all sellers? Only Brand Registered sellers have access through Brand Analytics.